 Giano Care
Request statistics
What comes in, how requests end up, and how many calls they take.
For owners
Statistics → Requests looks at the requests themselves rather than at the team. Only owners see it.
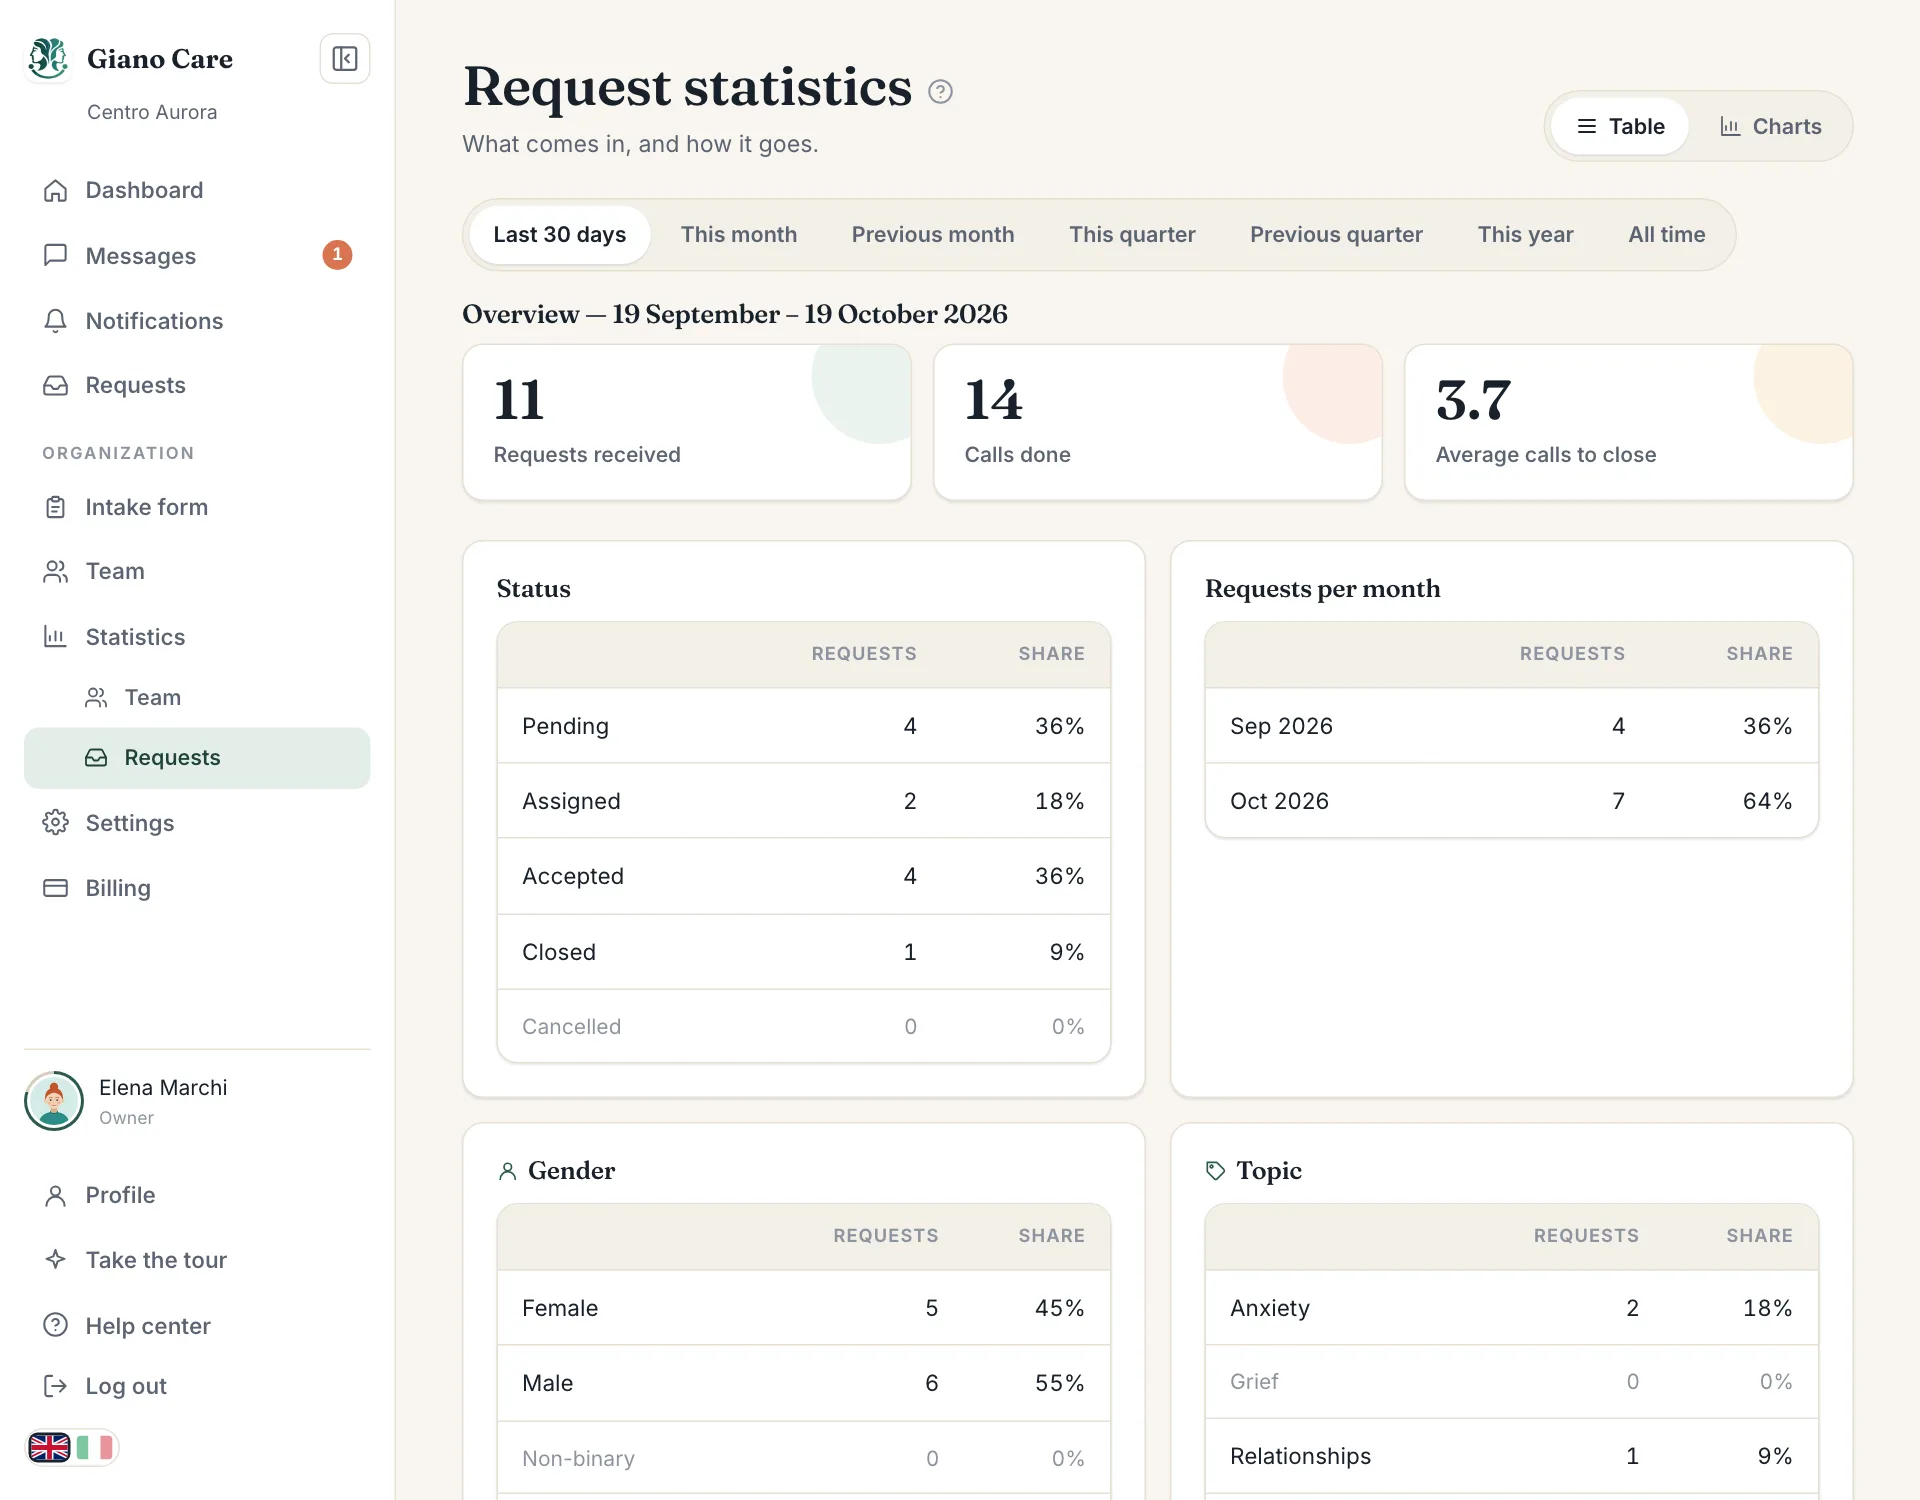
Overview
For the chosen period:
- Requests received: how many forms were sent.
- Calls done: how many calls were held.
- Average calls to close: how many calls a request takes, on average, before it is closed.
Status
How the requests received in the period stand today: how many are pending, assigned, accepted, closed or cancelled, with their share.
Over time
Requests per month (or per year for longer periods) shows whether demand is growing, and when your busy months are.
Table or charts
As with team statistics, choose the period at the top and switch View between Table and Charts. See Team statistics for the periods.